New maps of Arctic Ocean ice roughness demonstrate the value of NASA satellite’s instrument’s multiangular imagery
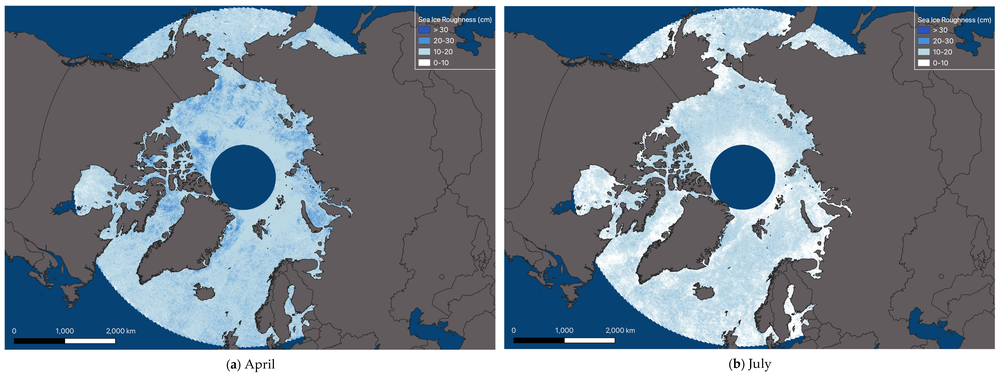
Arctic sea ice roughness (in centimeters) in April and July 2016 as derived from MISR observations by Mosadegh and Nolin (2022), which is licensed under CC BY 4.0.
Climate change is warming the Arctic faster than any other part of our planet. The rapid drop in ice cover in the Arctic Ocean basin has massive consequences, both for the people and animals who depend on the frozen sea for their way of life, and for the Earth as a whole. Now, a new study has demonstrated the use of data from the NASA Multiangular Imaging SpectroRadiometer (MISR) satellite instrument to derive Arctic-wide maps of sea ice roughness for the Arctic, which can be used to better understand the changing characteristics of the icepack.
The yearly minimum amount of Arctic sea ice is shrinking about 13% per decade compared to the average ice coverage from 1981 to 2010, as measured by satellites. At the same time, the amount of thick sea ice that is more than four years old has almost completely vanished during the last decade. Measurements of sea-ice roughness can tell us a lot about how the ice pack is changing. Older ice is thicker and rougher than thin, new sea ice, so ice roughness is an indicator of ice age. Ice roughness can also show where ocean currents and waves are causing ice to converge or collide, forming ridges that can be dangerous to passing ships. Moreover, smoother sea ice allows meltwater to accumulate on the surface of the ice in the summer in broad ponds, which causes the ice to melt faster since the meltwater absorbs more heat from sunlight than the ice.
As you might imagine, sea-ice roughness is very difficult to measure over a large area except by using instruments on airplanes or satellites. Some instruments can measure the ice roughness by bouncing a laser off the surface of the ice and measuring how the light reflects and scatters, a technique called lidar. This is the approach taken by the NASA ICESat satellites; the first ICESat operated from 2003-2010, and ICESat-2 was launched in 2018 and continues to operate today. From 2009 to 2019, NASA ran an airborne campaign called Operation IceBridge, which used several different lidars as well as radar instruments mounted on planes to measure sea-ice extent and roughness while satellite data was not available.
Another technique is synthetic aperture radar or SAR, a specialized type of radar which leverages the motion of the satellite to boost the resolution with which it can observe the Earth. SAR data is very effective at distinguishing surface features on the scale of centimeters, and it can observe in darkness and in cloudy conditions. There are several satellite SAR instruments operating today, using various radar wavelengths.
“ICESat-2 is a laser sensor, and so it has a narrow swath – about 17 meters wide – and its temporal resolution (repeat time) is 90 days. MISR has coarser spatial resolution, but it’s temporal resolution or repeat time is more frequent. We can use that data to create reasonable maps of Arctic-wide roughness in a more timely manner [compared to ICESat-2],” says Ehsan Mosadegh, lead author of the study and a Ph.D. candidate at University of Nevada, Reno. SAR data also has a higher spatial resolution and can see through clouds and in darkness, but Mosadegh adds that MISR is a good complement to SAR data because it can distinguish certain ice features that are difficult to identify in SAR data.
MISR is one of five science sensors on NASA’s Terra satellite, which launched in December 1999. It uses nine cameras pointed at different angles relative to the Earth’s surface to build up a stack of multiangular data in red, green, blue, and near-infrared wavelengths as Terra passes the Earth overhead. MISR’s unique instrument design and twenty-plus-year data record have proved very useful for a variety of scientific studies, from the composition of air pollution to the wind speeds of hurricanes – and, as it turns out, for the measurement of sea ice roughness.
As early as 2002, less than three years after MISR’s launch, science team member Dr. Anne Nolin and colleagues demonstrated that sea ice, ice sheets, and glaciers show distinctive signatures in multiangular data that depend on the surface roughness of the ice. However, the MISR data was only able to qualitatively distinguish between rough and smooth ice, unless quantitative measurements from other sensors could be used to calibrate the MISR angular signature data to physical measurements of surface roughness.
In 2019, Dr. Nolin published a second paper with another colleague showing that data from the Airborne Topographic Mapper (ATM) instrument, one of the lidar instruments flown during the Operation IceBridge campaign, could be used to perform this calibration. This training method, applied to MISR data taken over a small region of the Arctic Ocean, showed that ice-surface roughness could be garnered down to centimeter precision, with reasonable correlation against the lidar data.
“I saw [the 2019] paper as a proof-of-concept,” says Dr. Nolin, who is second author on the current study. “It was innovative but really small scale, and the processing was kind of clunky. Ehsan’s set of processing tools has allowed him to cover the entire Arctic, and we’ve never really seen Arctic-wide characterization of sea-ice roughness for two key time periods in the spring and summer [from MISR].” Mosadegh and Nolin had to overcome two main challenges to accomplish this: streamlining the process of deriving the ice-surface roughness and extending the model to much larger geographic areas while maintaining high accuracy.
In regard to the first challenge, Nolin’s previous code for the proof-of-concept – which co-located the ATM roughness measurements with MISR top-of-atmosphere reflectance measurements, identified the MISR pixels with sufficient ATM measurements as training data, and used the training data to predict roughness on the remainder of the MISR pixels – took 15 minutes to process a single orbit’s worth of MISR data of the Arctic on a typical laptop. With over 14 MISR orbits per day, it would therefore take the computer more than 5 continuous days just to process a single month of MISR data! Mosadegh’s first task was to optimize the code, resulting in compute times capable of processing the entire MISR data record if desired.
Mosadegh also undertook several tests to determine what characteristics led to the highest performing models of MISR-derived surface roughness. He found that selecting only MISR pixels that were co-located with at least 10 ATM measurements in the training model significantly improved model performance, as did limiting colocations to MISR and ATM measurements taken on the same day (Nolin’s previous work had also included ATM measurements taken the day before or after the day of the MISR observation). In addition, he tested three common types of predictor models: simple linear regression, polynomial linear regression, and K-Nearest Neighbor.
After testing the model on two months of MISR data, April and July of 2016, Mosadegh found that the K-Nearest Neighbor model far outperformed the other two types. “We realized that the relationship between the reflectance that MISR observes and the target [parameter sea ice] roughness is not linear. So, K-Nearest Neighbors can model this relationship better than the other linear models we tried, as we demonstrated in our paper based on performance metrics.”
After Mosadegh’s work was complete, he and Nolin had created an unprecedented MISR dataset: a complete map of ice-surface roughness of the Arctic Ocean basin covering the spring and summer of 2016. The final challenge was developing a compelling visualization of the massive dataset. “The visualization in a sense is like a play: Regardless of all the things that have happened behind the scenes, other people [not involved in the production] just see the maps, and maybe they enjoy it!” says Mosadegh.
After fine-tuning maps of the spring and summer ice roughness, the scientists were able to compare the two to observe some of the key sea-ice behavior in the Arctic during that time. They saw that areas in the Fram Straight to the east of Greenland and north of the extensive archipelago of islands that comprise Canada’s northeastern coast were among the roughest areas in the entire ocean basin in April. But those very rough areas had almost completely disappeared by July. This shows how melting of sea ice during the summer causes smoothening, as ice thins and melt ponds form on the surface.
Mosadegh and Nolin also compared the MISR roughness maps to images from the Landsat-8 and Sentinel-1 satellites. Landsat 8’s Operational Land Imager instrument provides images of the Earth with a resolution of 30 meters-per-pixel in several spectral bands. Sentinel-1 carries a type of synthetic aperture radar (SAR), allowing it to see through any cloud cover. Comparing the three sets of data show that the MISR sea-ice roughness maps can accurately distinguish between very rough areas (like complex ice) and smooth areas (either smooth ice or open water).
The comparison did demonstrate one complication of the MISR roughness dataset, which is that it can’t distinguish between very thin, smooth ice and open water, which also has a roughness close to zero. This is something that could be addressed in future work, either by creating a new classification model or by leveraging reflectance data in different parts of the electromagnetic spectrum, either from MISR or another instrument, Mosadegh says. Another challenge for future work is developing a reliable method of removing clouds from the MISR observations used to create ice roughness maps, as clouds and ice are both white and highly reflective.
“This research demonstrates that the multiangular imagery from MISR can provide a valuable stand-alone surface roughness product and MISR data are available from February 2000 to the present,” say Mosadegh and Nolin. MISR can provide ice roughness maps more frequently than ICE-Sat 2 and can complement SAR imagery for operational ice mapping. For instance, MISR can resolve areas of very thin ice that may be confused with multiyear ice in SAR imagery. Also, MISR can map sea ice characteristics during the melt season when SAR has difficulty distinguishing between melting sea ice and open water.
“Our overarching goal was to build something useful for the [Arctic sea ice] science community as something we can give back to the community that has helped us. So, they’ll be able to use this as a toolkit to create maps complementary to other data products,” says Mosadegh. To this end, the project code is freely available on GitHub. In the future, this technique could be applied to the entire MISR data record of more than 20 years to study the rapid change of the Arctic from year to year.
“There have been several studies that indicate that summer melting is getting worse over time. So, one application of this work would be looking at a time series of smoother areas of sea ice over the years, to see if visually anything is changing,” says Mosadegh. Nolin agrees, adding, “As climate change continues to progress, the balance between salty Arctic seawater and freshwater from ice melt is changing. Studying changing patterns of sea ice roughness can help scientists better understand areas where fresh water is affecting ocean circulation globally.”
On a more personal level, Nolin added: “It’s really inspiring for me as a mentor to see a student from Iran studying a region that he’s never been to, and creating this tool and knowledge that others can use. That’s one of the cool things about satellite data, that it enables this sort of work.”