Science Goals
Climate is what makes Earth habitable. And the climate is constantly changing -- as a consequence of both natural processes and human activities. We care a great deal about even small changes in Earth's climate, since they can affect our comfort and well-being, and possibly our survival. Even a few years of below-average rainfall, an unusually cold winter, or a change in emissions from a coal-burning power plant, can influence the quality of life of people, plants, and animals in the region involved.
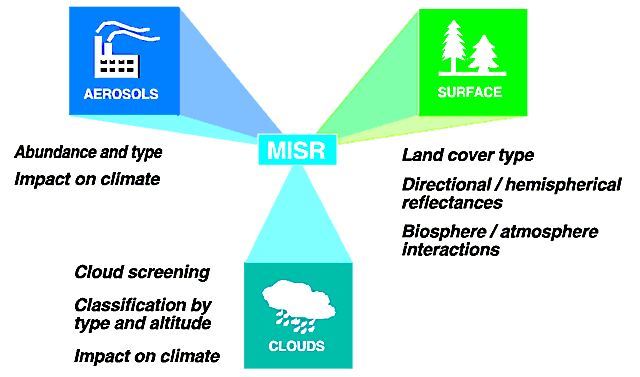
The goal of NASA's Earth Observing System (EOS) is to increase our understanding of the climate changes that are occurring on our planet, and the reasons for these changes, so we are better equipped to anticipate and prepare for the future. The MISR instrument is a part of EOS. Its role is to measure how much sunlight is scattered in different directions under natural conditions. This helps quantify the amount of solar energy that heats Earth's surface and atmosphere, and the changes that have occurred in these quantities over the twenty-plus year lifetime of the MISR instrument.
From the MISR observations, we also learn more about those components of Earth environment that scatter sunlight in the first place: particles in the atmosphere, the planet's surface, and clouds. MISR monitors changes in surface reflection properties, in atmospheric aerosol content and composition, and in cloudiness. We use these data to study the effects of land use changes, air pollution, and volcanic eruptions, as well as processes such as desertification, deforestation, and soil erosion. As part of the EOS program, climate models have been improved by the results of these studies.
MISR's Study of Atmospheric Aerosols
By Ralph Kahn, MISR Science Team
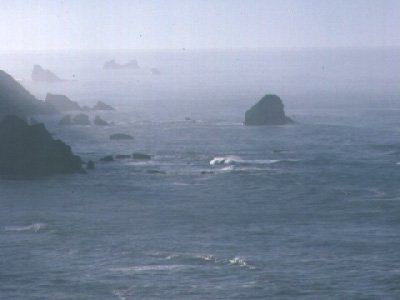
Mist and haze over the Pacific Ocean, Crescent City, California
Photograph by Graham Bothwell
What are aerosols?
Aerosols are tiny airborne particles. They occur naturally, originating from volcanoes, dust storms, forest and grassland fires, emissions from living vegetation, and sea spray. Human activities, such as the burning of fossil fuels and the alteration of natural surface cover, also generate aerosols. Averaged over the globe, anthropogenic aerosols (aerosols made by human activities) currently account for about 10% of the total amount, but most of this is concentrated in the northern hemisphere, especially within and downwind of urban and industrial areas, slash-and-burn agricultural regions, and overgrazed grassland.
Aerosol particles may be solid or liquid; they range in size from 0.01 microns to several tens of microns. [Cigarette smoke particles are in the middle of this size range; typical cloud droplets are 10 or more microns in diameter.] Under normal circumstances, most aerosols reside in the troposphere (lower atmosphere), where they are usually washed out of the air within about a week by rain. Aerosols are also found in the stratosphere (the atmosphere just above the troposphere). In addition to a perennial thin layer of sulfate aerosol, major volcanic events, such as the Pinatubo eruption in the Philippines in 1991, and severe wildfires sometimes inject large amounts of aerosol into the stratosphere. As it does not rain in this upper region of the atmosphere, these aerosols sometimes stay aloft for many months, producing beautiful sunsets around the globe, and possibly causing summer temperatures to be cooler than normal.
Why do we care about aerosols?
Aerosols tend to cause cooling of the surface below them, as most aerosols are bright particles that reflect sunlight back to space, reducing the amount of solar radiation that can be absorbed at the surface. The magnitude of this effect depends on the size and composition of the aerosols, their vertical distribution, and on the reflecting properties of the underlying surface. Aerosol cooling may partly offset the expected warming due to increases in the amount of atmospheric carbon dioxide from human activities; however, the distribution of aerosols is skewed toward the northern hemisphere, where there is more land surface (as well as more human activity), whereas on average, carbon dioxide is more uniformly distributed around the planet.
Aerosols also have "indirect" effects on climate, by changing the properties of clouds. Increased aerosol in a cloudy region often results in smaller cloud particles. This generally produces brighter clouds, and ones that last longer, as smaller cloud droplets are less likely to coalesce and fall out of the atmosphere as rain.
Prior to the launch of the NASA Earth Observing System’s Terra satellite, with MISR aboard, major aerosol types had been identified, and general ideas about the amount of aerosol to be found in different seasons and locations had been developed. But quantitative information and key details about aerosol amounts and properties, needed to calculate even their current effect on surface temperatures, were lacking, and there were few observations that credibly reported the trends in any of these quantities. Particle abundances, variations in aerosol size and composition, and the magnitudes of aerosol sources and sinks had never been systematically measured on a global basis. In addition, the size of the indirect aerosol effects on climate was largely unconstrained.
How MISR is helping
Currently, satellite instruments provide our best hope of making, at reasonable cost, the routine, global-scale observations of aerosols needed to measure their climatic effects. However, such instruments must rely on remote sensing – interpreting the light collected at a distance from the aerosols themselves – to derive aerosol amount (usually reported as aerosol optical depth) and particle properties. This science is termed remote sensing aerosol retrieval. As the scattered light contains only circumstantial evidence about aerosols, we must exploit our understanding of the physics of light scattering to deduce what we can about aerosol properties from such data; we must also make some assumptions. The result is qualitative discrimination of different aerosol “types,” based on the retrieved particle properties. Key details can be filled in by associating aerosol type with particle microphysical and chemical properties measured from aircraft or ground station in situ aerosol samples. Computer models must play an essential role as well, not only making predictions of future climate based on the current state and projected changes in aerosol loading, but also identifying the sources and aging history of aerosol types mapped from space and the samples acquired by suborbital instruments.
Remote sensing aerosol retrieval had been an area of active research for about 20 years prior to the start of the MISR mission. Until then, nearly all routinely available global-scale aerosol products used single view-angle data in one or two spectral bands to derive aerosol amount over oceans, based on assumed particle size distributions and composition.
MISR is the first NASA satellite instrument to collect multi-angle as well as multi-spectral data for aerosol studies. The additional information contained in these data provides constraints on particle size, shape, and light-absorption properties, along with aerosol amount, over ocean and all but the brightest land surfaces. Under good retrieval conditions, MISR can distinguish 3-5 groupings in particle size (e.g., small, medium, large), two-to-four groupings in particle brightness (e.g., “dirty” and “clean”), and spherical from randomly oriented non-spherical particles (Figure 1). Further, the elevation of clouds and aerosol plumes can be derived stereoscopically from the MISR imagery, and with nine angular views acquired over about seven minutes, the proper motion of plume elements can also be determined.
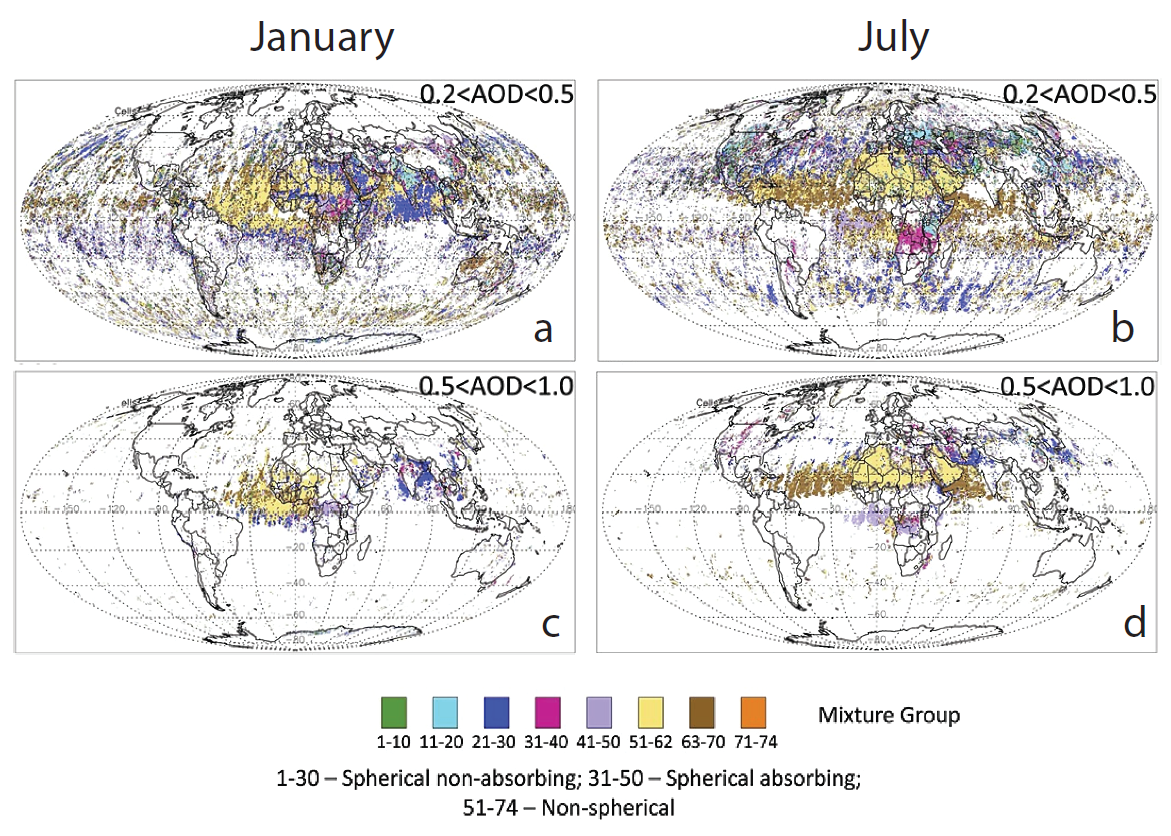
Figure 1. Maps of MISR aerosol type characterization for January and July 2007. Results are shown for moderate and high aerosol amounts (mid-visible AOD between 0.2 and 0.5, and between 0.5 and 1.0, respectively). The color bar captures particle-type discrimination at three levels of detail, first separating spherical non-light-absorbing particles from mixtures containing spherical light-absorbing and non-spherical particles. Finer discrimination by broad size, shape, and absorption properties is shown by the eight color chips, and yet more detailed classification is reflected in the 74 specific underlying aerosol mixtures. The MISR retrieval algorithm accepts all mixtures that pass measurement-uncertainty based criteria. As such, the tighter the available particle-type constraint from a given measurement set, the shorter the list of mixtures accepted by the algorithm. (From: Kahn and Gaitley, JGR 2015.)
The MISR aerosol retrieval products continue contributing to regional and global assessments of particle amount for climate and air quality applications, mainly adding quality retrievals in places where broader-swath, single-view instruments have difficulty obtaining good-quality results. MISR’s unique aerosol plume-height mapping and particle-type discrimination have proven valuable for aerosol transport modeling, for identifying regional differences among biomass burning and other particle types, and especially for process studies in wildfire smoke, volcano, and dust plumes, where the concentrated aerosol amount provides excellent observing conditions for these retrievals.
MISR plume heights and motion vectors, along with aerosol amount, have been used to locate desert dust sources in North Africa and the Middle East. For volcanic plumes, MISR retrievals distinguish small-medium, spherical, non-light-absorbing sulfate particles, which are a pollution hazard, from large, non-spherical, light-absorbing ash, which is in addition a risk to aircraft. In wildfire smoke plumes, MISR can separate small-medium, spherical, spectrally flat particle absorption due to black smoke from spectrally steep brown smoke (Figure 2). Finer particle-property distinctions are possible as particles evolve downwind from these sources. Changes in retrieved effective particle size and light-absorption, along with aerosol amount and plume height, can be interpreted in terms of the processes that govern particle evolution, such as size-selective or size-independent particle deposition, particle aggregation, particle hydration or oxidation, and secondary aerosol formation. Combining this information with the MISR-retrieved wind vectors makes it possible to estimate the timescales over which these processes operate.

Figure 2. (a) True-color context image of the Government Flats fire plume, 21 August 2013, acquired by the MODIS instrument coincident with the MISR observations. Annotations show MISR-derived plume-age estimates and four regions where particle properties change significantly. (b) MISR stereo-derived, wind-corrected (blue) and zero-wind (red) downwind plume height profile for the Government Flats fire plume. The surface elevation is indicated in green. (c) Mid-visible fractional aerosol amount identified as black smoke and (d) brown smoke for the same fire derived with the MISR RA. The fire source is indicated by a red star in each panel. (From: Junghenn-Noyes et al., Remote Sensing 2020).
Applying MISR data for air quality applications requires additional constraints on aerosol vertical distribution and often more detailed speciation than is offered by aerosol “type” alone. This is being achieved by combining MISR regional aerosol mapping with surface-monitor data and physical modeling, using advanced statistical methods. Generally, the application of satellite data to air quality studies is an area of research in its infancy. However, progress has already been made in demonstrating the contribution MISR and other remote-sensing aerosol data can provide on a regional basis. This is especially true downwind of pollution sources and existing surface monitors, and in underserved areas, where surface air quality monitoring is lacking, such as much of the Global South.
The uncertainties in aerosol direct and indirect effects are as yet the largest contributors to overall uncertainty in climate-prediction modeling. With continuing improvements in retrieval and analysis techniques, including better physical modeling, new machine learning approaches, and more effective techniques for combining satellite and suborbital data with climate and air quality models, the MISR data record, over two decades long, offers a foundational contribution upon which future studies of aerosol environmental impacts and trends can build.
A more detailed review of MISR contributions to aerosol science can be found here:
Kahn, R.A., Y. Liu, and D.J. Diner, 2021. Space-based passive aerosol remote sensing from the Multi-angle Imaging SpectroRadiometer (MISR) aboard NASA’s Terra satellite. Springer Nature, Handbook of Air Quality and Climate Change, H. Akimoto & H. Tanimoto, Eds.
MISR's Study of Clouds
By Roger Davies, MISR Science Team
Why study clouds from space?

Clouds over Mauna Kea, Hawaii
Photograph by Graham Bothwell
More than any other component of the climate system, clouds affect the flow of energy within Earth's atmosphere, and to its surface. The impact of clouds on sunlight ranges from the high reflectivity of thunderclouds, which may allow so little light to reach the surface that it seems the Sun has set prematurely, to the subtle, iridescent colors of sunlight transmitted through thin cirrus. The influence of clouds extends to the infrared portion of the spectrum, where they make an important contribution to Earth's natural greenhouse. You may have observed the effect of clouds on infrared radiation -- on cloud-free nights, it tends to be cooler than on nights when there is a persistent low cloud cover.
In addition to their radiative effects, clouds play a key role in Earth's water cycle. The energy it takes to evaporate water from Earth's surface is called latent heat. When the vapor condenses in the atmosphere to form clouds, this latent heat is released, only to be used up again when the cloud evaporates. However, if the liquid or ice formed in the cloud grows to produce precipitation, the latent heat remains behind, warming the atmosphere and helping to drive atmospheric circulations.
Although clouds are essential to climate studies, they are difficult to describe mathematically in climate models. A wide variety of cloud properties must be taken into account: shapes, sizes, vertical and horizontal locations, lifetimes, numbers of liquid droplets of different sizes, numbers of ice crystals of different shapes and sizes, and more. The way clouds absorb, scatter, and emit radiation is influenced by each of these properties. The effects of clouds on climate are so complicated that the leading climate models give conflicting answers regarding their impact of climate. There is even uncertainty as to whether the changes in cloud properties will amplify or diminish any surface warming that may be caused by increasing atmospheric greenhouse gases. In fact, the present uncertainty in treating the radiative effect of clouds in climate models may be larger than the entire radiative consequences expected from a doubling of carbon dioxide.
So how can we get a better grasp on the climatic effects of clouds? The answer is to make many more observations of cloud properties, along with measurements of the visible and infrared radiation fields they produce. Theoretical models can help us choose which properties to measure.
Since the global climate is affected by the long-term average of all the cloud radiative effects, summaries of the details may be all we really need to model future change. [One catch, however, is that we must be careful that the summaries depend on physical relationships between clouds and radiation. If they are simply empirical relations obtained for the present climate, they may not apply to a future climate state.] "Making these measurements" is where the satellites come in.
Satellites cannot provide all the answers. But measurements of radiation from space can play a big role in helping us understand how radiation depends on cloud properties. They can also help us identify which cloud properties are the most critical ones to measure. For example, for a long time the reflective properties of clouds were modeled assuming the clouds could be treated one-dimensionally, having flat tops and no sides. We now know from analyzing lots of global satellite observations that cloud sides and non-flat cloud tops are too important to be neglected.
The beauty of satellite-based measurements is that they offer the only practical way of making cloud measurements over the entire global. A single satellite instrument orbiting Earth can provide global coverage in a few days, and modern computers can help us dig the important information out of the vast amounts of data produced.
What is MISR telling us about clouds?
One of MISR’s early successes has been its proven ability to measure cloud heights from space. This is done using stereo views from different pairs of its nine cameras. For some clouds it has even been possible to reconstruct the cloud volume from top to bottom by scanning down the cloud sides. From these measurements we now have a better understanding of the entire water content of certain cloud types, which turns out to be much higher than previously inferred from single angle measurements.
The geometric nature of MISR’s cloud height measurements means that they are not affected by the temperature fluctuations that can affect other types of remote sensing. The time series of cloud height provides a useful climate data record that is thus very uniform and very well sampled on a global basis. We have been able to clearly identify both local and global changes in cloud heights of interest. The pattern of changes across the globe, called teleconnections, stand out clearly, and are in turn affected by the state of the El Niño or Southern Oscillation (ENSO). In fact, ENSO-related fluctuations and their teleconnections have proven to be so strong that they dominate the time series, even on a globally averaged basis.
One property of clouds that is often overlooked when using single angle remote sensing is that they also act as tracers of the wind flow. This is very apparent using the multiangle views from MISR, as it takes about 7 minutes from the first to the last camera view of a given cloud. For many clouds it has proven possible to separate the height effect from the motion effect, so that cloud-tracked winds can be measured. With rapid operational processing, these winds provide additional useful data to numerical weather prediction schemes, especially over the vast oceanic regions that have sparse conventional wind measurements.
While the overall cloud-height time series is mainly associated with high clouds (cirrus), low clouds are also of interest, and here the stereo retrieval is particularly helpful in resolving ambiguous cases of bright reflectivity, especially over polar regions where the surface can be highly reflective. By comparing the retrieved height with the known height of the surface, it becomes obvious when the measurement is from a cloud, greatly improving our measures of cloud fraction in difficult situations.
Continuing with low clouds, MISR is providing insight about how the properties of boundary-layer clouds over the world’s oceans affect the energetics of those regions through their albedo. This will ultimately help the coarse resolution climate models to improve their cloud parameterizations. MISR has shown, for example, that in addition to the expected dependence of regional albedo on cloud fraction, cloud morphology (that is, the shapes of clouds, including the texture of the cloud top) is a crucially important factor that must also be included.
More generally, regional albedos and their potential changes remain a key interest. The darkening of the Arctic over recent times has been well measured by MISR. This is due not only to the reduction of sea-ice at the surface, but also to changes in cloud cover. It is interesting that the northern hemisphere as a whole appears to be darkening significantly relative to the southern hemisphere, and this is probably related to changes in the Arctic, together with changes in clouds that affect the overall albedo.
These and other challenges associated with clouds will continue to be of interest in the use of MISR for the foreseeable future: how their height changes add to or subtract from the effect of their albedo changes; how teleconnections propagate equatorial changes globally; how the lower limit of observable thin cirrus can be extended using the most oblique stereo views; and so on.
MISR's Study of Earth's Surface
By John Martonchik, Anne Nolin, and Mark Chopping, MISR Science Team
What effect does Earth's surface have on Earth's energy balance?
The Earth’s land surface is a complex quilt of soil, vegetation, lakes & rivers, snow, and glaciers. Each of these land surface components reflects sunlight in different amounts and angular patterns. For instance, in the visible wavelengths, forests are dark and snow is bright but in the near-infrared wavelengths, forests are bright but snow is dark. Their angular reflectivity varies too. Smooth water and ice can produce glinting reflections whereas rough soil and vegetation scatter light more evenly across all angles. Changes in the land surface occur seasonally, as trees and grasses become green, as snowcover grows and melts, and sometimes suddenly, as when wildfires and extreme weather affect a region. Land surface processes are important components of the terrestrial climate system. These processes include two-way exchange of radiation (in the form of sunlight and heat) and matter (particularly gases such as water vapor and carbon dioxide) between the surface and atmosphere. Scientists measure these exchanges in terms of flux, which is the rate of flow of radiation or matter across a unit surface area. Different surface types (rocky surfaces, bare soils, vegetation, snow, etc.), characterized by their physical, chemical, and structural properties, will impact these fluxes, each in its own way. Observations of the changing land surface can inform us about changes in these key fluxes, and changes in Earth’s climate.
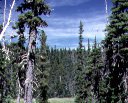
Vegetation canopies play important roles in determining climate at local to global scales. If vegetation covers bright mineral soils, it usually lowers surface albedo, leading to warming. Conversely, plants transpire water vapor through holes in their leaves called “stomata”, thereby cooling themselves and their surroundings. Vegetation also plays an important role in determining the carbon content of the atmosphere: since plants ingest carbon dioxide as their primary food source and woody plant parts may persist for many years, forests play an important role in limiting climate forcing from human greenhouse gas emissions by storing a lot of carbon in their woody stems and branches (collectively termed “aboveground biomass”). However, hotter, drier forests impacted by insect outbreaks and pathogens that thrive under warmer conditions are more susceptible to larger and more severe wildfires that release the carbon back to the air, so it is important to monitor our forests.
What can MISR tell us about Earth's changing land surface?
Most satellite-based sensors look at Earth in a single direction, usually vertically downward. Yet, except for movie-screen material, common surfaces reflect different amounts of sunlight in different directions. So, to accurately measure the total amount of sunlight reflected from our planet, the Earth's surface must be viewed from multiple directions. The “albedo” of Earth materials is a measure of the amount of solar energy (sunlight) that is reflected vs. absorbed. For instance, snow and ice are very bright, with high albedo values whereas dark soil and dense vegetation have low albedo values.
For vegetated terrain, knowing the albedo more accurately may lead to improved estimates of the rates of photosynthesis and plant growth. These parameters play an important role in constraining models that describe the way surface vegetation and the atmosphere interact. Overall, changes in albedo control how much solar energy is reflected or absorbed, which -- along with greenhouse gases, particles in the air, and other factors -- are important in determining Earth’s climate. Thus, multi-angular measurements of reflected sunlight from MISR are critical for mapping Earth’s surface albedo and understanding changes in climate.
MISR’s angular measurements of reflected sunlight are useful in other ways. We know that smooth surfaces reflect sunlight in the forward direction (away from the sun) while rough surfaces reflect light back towards the sun. MISR is unique among remote sensing instruments in that it can simultaneously view the Earth’s surface at nine different directions, providing key information about the roughness and structure of forests, grasslands, soil, snow, sea ice, and ice sheets, etc.
MISR multi-angular data hold much potential for mapping and monitoring different land cover types of and how they are changing on a global basis. This is because different land surfaces reflect different amounts of light in different directions: the patterns in measurements of reflected light made at multiple view angles change with land cover type (grasslands, woodlands, forests, rivers and lakes, towns and cities, and so on). These patterns also show sensitivity to forest density and tree heights. Thus, they provide information about changes in forests and the amount of woody material ("aboveground biomass") they hold. MISR data can thus be used to map forest aboveground biomass over large areas, as well as land cover.
Multi-angular measurements can also help us better understand changes snow, sea ice, and ice sheets. For instance, new snowfall over the Greenland ice sheet is bright and smooth but as over the summer months, the snow melts revealing the rougher, less reflecting ice beneath. MISR’s multi-angular views can measure sea ice roughness, which can then be used to map seasonal changes in ice cover over the polar oceans.
The more we explore multi-angular remote sensing of the Earth’s surface, the more we realize that angular remote sensing provides unique and valuable information about our planet – and MISR is leading the way with discoveries and new applications.